James O. Westgard
Linki görmek için üye olunuz


Recommended minimum studies
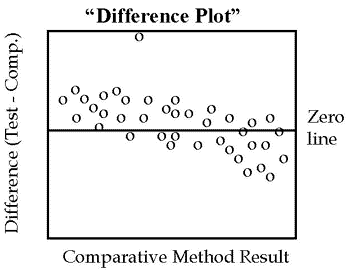
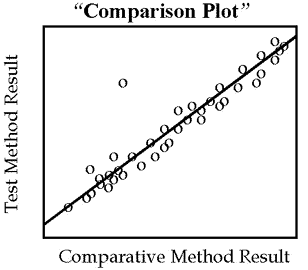
Select 40 patient specimens to cover the full working range of the method. Analyze 8 specimens a day within 2 hours by the test and comparative methods. Graph the results immediately on a difference plot and inspect for discrepancies; reanalyze any specimens that give discrepant results to eliminate outliers and identify potential interferences. Continue the experiment for 5 days if no discrepant results are observed. Continue for another 5 days if discrepancies are observed during the first 5 days. Prepare a comparison plot of all the data to assess the range, outliers, and linearity. Calculate the correlation coefficient and if r is 0.99 or greater, calculate simple linear regression statistics and estimate the systematic error at medical decision concentrations. If r<0.99, estimate bias at the mean of the data from t-test statistics. Utilize the Medical Decision Chart to combine the estimates of systematic and random error and make a judgment on the total error observed for the method.
Tagler: Method Comparison, Westgard
Comments:  (0)
(0)
Henüz yorum yapılmamış